Quandl R Api
Quandl R API: an easy way to get economic data
Introduction
Quandl is an online platform that allows you to browse and download financial and economic time series from a wide list of sources such as the World Bank, Euro Stat, WHO, etc.
They have a set of APIs that allow you to query their database via
Python and R. The usage of the API is free of charge for most data
sources (there are some Premium data sources for which you’ll have to
pay if you want to use them). There are some restrictions on the number
of calls per day that you can make, but by registering for free you get
an API key which waives those restrictions.
Start by downloading and installing the package from CRAN:
#install.packages("Quandl")
library(Quandl)
#install.packages("ggplot2")
library(ggplot2)
Quandl.api_key("your_api_key")
How to use it
The first thing you need to do is head over the Quandl website, search for the data that you’re interested in and then copy the appropriate Quandl code (it’s usually on the top-right corner). You then store all the codes you want to download in a vector. I usually include a ‘names vector’ as well so that the series names are easy to read.
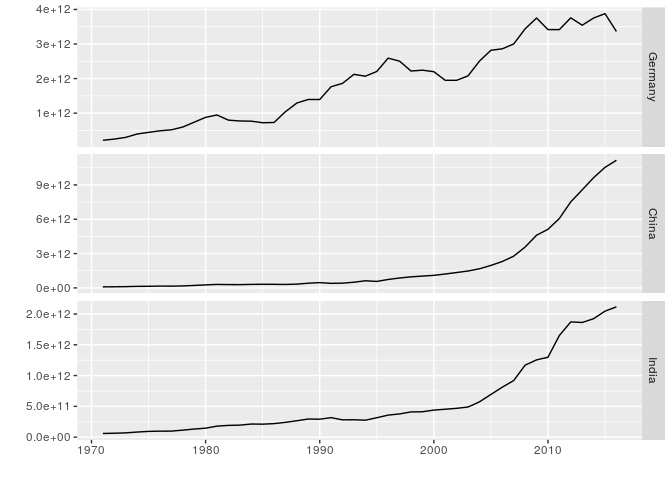
In this example I’ll download the GDP of three countries:
- Germany: UNAE/GDPCD_DEU
- China: UNAE/GDPCD_CHN
- India: UNAE/GDPCD_IND
codes <- c("UNAE/GDPCD_DEU", "UNAE/GDPCD_CHN", "UNAE/GDPCD_IND")
names <- c("Germany", "China", "India")
We can now make the actual API call, which you can do with the Quandl
function. The main parameters are:
code: a vector containing the Quandl codes of the series to be retrievedtype: the object type to be returned (eg: time series, zoo, data frame, etc)start_dateandend_datecollapse: to define the frequency of data (eg: monthly, quarterly, annual, etc)- see the documentation page for more
data <- Quandl(code = codes,
                 type = "zoo",
                 start_date = "1970-12-31",
                 end_date = "2015-12-31"
                 )
That’s it. The three time series are now saved in a zoo object and can
be easily plotted or used for time series analysis.
Note that the Query returned a series of other economic indicators as
well (use colnames(data) for the list), so you’ll have to select the
GDP values from the zoo object.
data_gdp <- data[,c(9,18,27)]
colnames(data_gdp) <- names
autoplot.zoo(data_gdp) +
  xlab("") +
  facet_grid(Series ~ ., scales = "free_y")