Nasa Api Meteorites
Using NASA’s API to Visualise Meteorite Landings on Google Maps
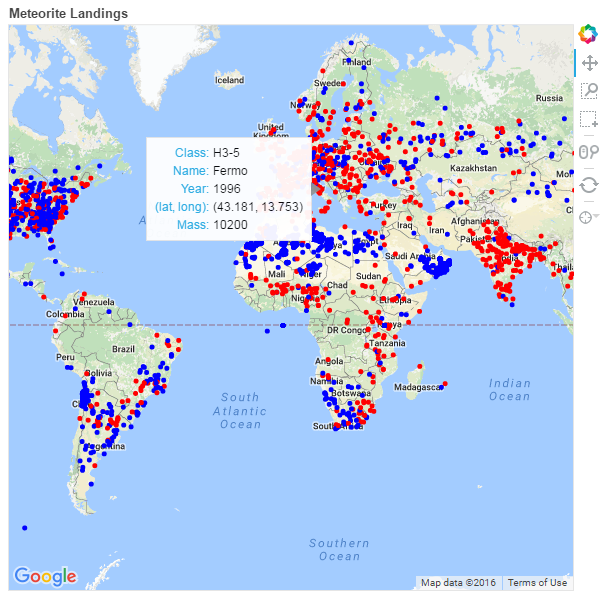
Ever wondered how many meteorites hit Earth every year and, more importantly, where? In this blog post, we’ll access the relevant data via NASA’s API and visualize it on Google Maps using the Bokeh library and the Google Maps API.
According to Wikipedia, a meteorite is a solid piece of debris from an object, such as a comet, asteroid, or meteoroid, that originates in outer space and survives its passage through the Earth’s atmosphere and impact with the Earth’s surface.
It has been estimated that over the whole surface area of Earth, about 18,000 to 84,000 meteorites bigger than 10 grams hit Earth every year.
But don’t worry too much, the chances to get hit by one are rather small. Astronomer Alan Harris has calculated that, allowing for the number of Earth-crossing asteroids — the kind that can hit us because their orbits around the Sun intersect ours — as well as how much damage they can do (which depends on their size), any person’s lifetime odds of being killed by an asteroid impact are about 1 in 700,000.
import numpy as np
import pandas as pd
import requests
You can find all resources and information on the data available on the NASA Data Portal. More detailed information around the API and the Meteorite Landings data can be found here.
Here we’ll use the Requests library to retrieve the data in json format and convert it in a Pandas Data Frame.
# Define the API endpoind:
url = "https://data.nasa.gov/resource/y77d-th95.json"

# Call API and get json response:
response = requests.get(url)
if response.status_code == 200:
    data = response.json()

# Store response in DataFrame
df = pd.DataFrame(data)
We get back a dataset containing details on the name and composition of the meteorite, its mass, geographical coordinates, wether it was found or its fall was observed and the year the occurrence happened.
df.columns.values
array([':@computed_region_cbhk_fwbd', ':@computed_region_nnqa_25f4',
       'fall', 'geolocation', 'id', 'mass', 'name', 'nametype', 'recclass',
       'reclat', 'reclong', 'year'], dtype=object)
We get rid of some columns as they provide no additional information. We then print the first three rows of data to the screen to have a look at it:
del df["geolocation"]
del df[":@computed_region_cbhk_fwbd"]
del df[":@computed_region_nnqa_25f4"]
df.head(3)
| fall | id | mass | name | nametype | recclass | reclat | reclong | year | |
|---|---|---|---|---|---|---|---|---|---|
| 0 | Fell | 1 | 21 | Aachen | Valid | L5 | 50.775000 | 6.083330 | 1880-01-01T00:00:00.000 |
| 1 | Fell | 2 | 720 | Aarhus | Valid | H6 | 56.183330 | 10.233330 | 1951-01-01T00:00:00.000 |
| 2 | Fell | 6 | 107000 | Abee | Valid | EH4 | 54.216670 | -113.000000 | 1952-01-01T00:00:00.000 |
A quick analysis of missing values shows that we don’t have the geographic position for over 7,000 instances.
# Dealing with Null values
df.isnull().sum()
fall           0
id             0
mass         131
name           0
nametype       0
recclass       0
reclat      7315
reclong     7315
year         291
dtype: int64
As you may have already noticed, the format of the year field is a timestamp with milliseconds precision (eg: ‘1952-01-01T00:00:00.000’), but the only information it carries is with regards to the year, therefore we can strip out most of it and retain only the first 4 characters.
We then convert our variables to float and string types accordingly:
df["year"] = df["year"].str[:4]
df[["id", "mass", "reclat", "reclong", "year"]] = df[["id", "mass", "reclat", "reclong", "year"]].astype(float)
df[["fall", "name", "nametype", "recclass"]] = df[["fall", "name", "nametype", "recclass"]].astype(str)
The variable fall indicates wheter a meteorite was found or if its fall on Earth was observed. A simple group by reveals that almost 98% of the instances in our database where not observed directly.
df.groupby("fall").size().sort_values(ascending=False)[:10]
fall
Found    44609
Fell      1107
dtype: int64
Before we start building the Map I’ll add one more column to the dataset and call it fill. I’ll assign the string “Red” to instances whose fall was observed and “Blue to meteorites that were found. This way, we will be able to assign different colors to each instance on our map.
df["fill"] = df["fall"].map({'Fell':"Red", "Found":"Blue"})
We will use the Python library Bokeh to visualize the meteorites, so make sure you install the libary before proceeding; the following code was modelled on the back of this script.
The other thing you’ll need to proceed is a Google Maps API Key, which you can request here.
from __future__ import print_function
from bokeh.util.browser import view
from bokeh.document import Document
from bokeh.embed import file_html
from bokeh.models.glyphs import Circle
from bokeh.models import (
    GMapPlot, Range1d, ColumnDataSource, PanTool, WheelZoomTool, BoxSelectTool, BoxZoomTool, ResetTool, HoverTool, GMapOptions)
from bokeh.resources import INLINE
# Setting the data ranges:
x_range = Range1d()
y_range = Range1d()

# Feel free to change the map's initial position (lat, long) or the type of map and level of initial zoom:
map_options = GMapOptions(lat=0, lng=0, map_type="roadmap", zoom=2)

# Google Maps now requires an API key. You can find out how to get one on the link above.
# Replace the string below with you own API Key:
API_KEY = "your_own_API_Key"

#Initializing the GMapPlot object:
plot = GMapPlot(
    x_range=x_range, y_range=y_range,
    map_options=map_options,
    api_key=API_KEY,
)
plot.title.text = "Meteorite Landings"

# Defining data elements (as lists) that will go into the Map and its Tooltip:
source = ColumnDataSource(
    data=dict(
        lat=list(df.reclat),
        lon=list(df.reclong),
        fill=list(df.fill),
        mass=list(df.mass),
        year=list(df.year),
        recclass=list(df.recclass),
        name=list(df.name)
    )
)

# Adding Map's Glyphs:
circle = Circle(x="lon", y="lat", size=5, fill_color="fill", line_alpha=0)
plot.add_glyph(source, circle)

# Initialize Map Tools:
pan = PanTool()
wheel_zoom = WheelZoomTool()
box_select = BoxSelectTool()
box_zoom = BoxZoomTool()
reset = ResetTool()
# This allows you to specify what goes in the Map's Tooltip
hover = HoverTool(
        tooltips=[
            ("Class", "@recclass"),
            ("Name", "@name"),
            ("Year", "@year"),
            ("(lat, long)", "(@lat, @lon)"),
            ("Mass", "@mass")
        ]
    )

plot.add_tools(pan, wheel_zoom, box_select, box_zoom, reset, hover)

# Write to a HTML file:
doc = Document()
doc.add_root(plot)

if __name__ == "__main__":
    filename = "maps.html"
    with open(filename, "w") as f:
        f.write(file_html(doc, INLINE, "Google Maps Example"))
    print("Wrote %s" % filename)
    view(filename)